
Electrocardiography is a method used to analyze the heart’s conduction system, which provides us with information about the heart’s electrical activity. The recording of the conduction system is physically represented as an ECG. This quick and pain-free examination makes it possible to assess the electrical activity of the heart and to detect potential cardiac disturbances.
How do electrical impulses flow throughout the heart?
What information can an ECG provide?
The heart muscle pumps blood in a specific rhythm throughout the entire body. In order to do this, the heart muscle must contract, which requires an electrical impulse. This electrical impulse comes from the sinus node (located in the right atrium), which acts as the heart’s natural pacemaker. The electrical current is then transmitted via specific pathways throughout the heart, enabling regular contraction and relaxation. This electrical current can be detected on the surface of the body (i.e. the chest wall) via adhesive electrodes.
Pathway of the electrical impulse:
From the sinus node, the electrical impulse starts by spreading throughout the atria (from right to left). When this happens, the cells lose their internal negativity, a process known as depolarization. The depolarization of the atria causes them to contract.
The electrical current then spreads to the atrioventricular node (AV node), from where it is further transmitted to the intraventricular Septum (separates the left and right ventricles). In order to depolarize the ventricles, the electrical impulse travels through the bundle of His, along the right and left bundle branches (from left to right), and ends at the Purkinje fibers. This process causes depolarization of the ventricles, causing them to contract.
While the ventricles are being depolarized, the atria are regaining their internal electrical negativity, a process known as repolarization. This allows them to relax. Once the ventricles have fully depolarized, they too become repolarized, and which point they relax as well.
The picture below shows a simplified version of the conduction system’s pathway.
The entire process of depolarization and repolarization is depicted on the ECG. The individual events are represented as spikes and waves, each representing a specific part of the cardiac conduction cycle. This visual representation of the conduction system makes it possible to analyze the heart’s electrical activity.
The picture below shows the pathway of an electrical impulse as it corresponds to the spikes and waves on an ECG. To do this, the heart is shown on its side.
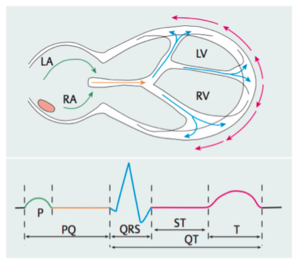
Figure 2: Pathway of an electrical impulse as it corresponds to the spikes & waves on an ECG (Source: Trappe, H-J/Schuster, H-P: EKG-Kurs für Isabel. Stuttgart, 6. Auflage (2013), S. 3 Abb 1.2)
The P wave represents the depolarization (contraction) of the atria, the PR segment the transmission of the electrical impulse to the ventricles, the QRS complex represents depolarization (contraction) of the ventricles and the T wave shows the repolarization (relaxation) of the ventricles. When disturbances of the conduction system are present, this can be detected via abnormalities of the spikes and waves on an ECG.
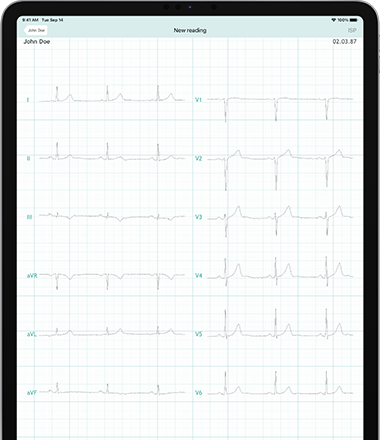
An electrocardiogram uses electrodes attached to the skin, which are able to detect electrical currents, in order to provide us with information about the heart. The information detected by the electrodes is used to calculate measurements, known as leads. A “lead” is an angle of looking at the heart. A standard ECG includes 12 leads, i.e. 12 different angles of orientation in regards to the heart. Each lead provides us with information about different parts of the heart. A standard ECG typically requires 10 electrodes in order to provide a 12-lead view.
Six Limb leads on the vertical/frontal plane: 3 Standard (I, II, III) and 3 Augmented (aVR, aVL, aVF)
Six Precordial leads on the horizontal plane: V1-V6
Supplementary leads: V7, V8, V9
An ECG provides us with information about the heart’s rhythm and rate, problems with the conduction system and/or its electrical axis. Circulation problems of the coronary arteries can also be detected, which can help to diagnose a heart attack.
Various cardiac disorders can be detected via ECG changes:
An ECG can be performed as a resting, exercise or long-term ECG.
Resting ECG
During a resting ECG the body must be relaxed (at rest), as the neighboring muscles and nerves also produce electrical tension. The electrodes are attached to predetermined locations on the body, located on the chest, arms and legs, which are connected to the ECG machine via a cable. The electrodes can detect electrical tension of less than a millivolt, which is then transcribed onto graph paper to produce an ECG.
Exercise ECG
An exercise ECG (or stress ECG) is performed under physical stress, as some changes are only detected when the heart is strained. For example, a resting ECG is particularly unremarkable in the setting of Coronary Artery Disease (CAD).
Many heart rhythm disorders or ECG changes can be better detected and diagnosed via an exercise ECG. In addition, an exercise ECG is performed as part of the evaluation of chest pain in certain situations:
As with a resting ECG, the electrodes are attached to the skin and are connected to the ECG machine via a cable. The patient is placed on either a treadmill or a stationary bicycle. The level of resistance/speed is increased at regular intervals (usually every 2-3 minutes) until the patient can no longer exercise, the maximum heart rate is reached or symptoms and/or ECG changes indicating stress to the heart are present. The ECG reading, heart rate and blood pressure are continuously monitored during the test, and for a few minutes following, in order to observe the return of the heart rate to its baseline.
An exercise ECG should not be performed in the following situations, as it could cause cardiac injury:
Long-term ECG
An additional way to measure the activity of the heart is a long-term ECG. This measures the heart’s activity over 24 hours and can therefore detect many changes. The electrodes are attached to the skin and connected to a small mobile recording device via a cable. The gathered data is then interpreted by a physician.
A long-term ECG is often used in the following situations:
Long-term ECG’s are typically used to monitor heart rhythm or rate disturbances.